Is the ground under a Spanish property moving?
A survey looks at the building. The nota simple tells you who owns it and what it owes. Neither says whether the ground under it has been sinking for the last five years. That is measured anyway, from orbit, by a European public service, and you can look it up yourself in twenty minutes. This guide shows you how, and, more important, how not to misread what you find.
What the survey and the land registry do not cover
At home you have a routine for this. In the UK you order a RICS survey. In the Netherlands you book a bouwkundige keuring. In France the seller has to hand you the état des risques before you sign. In Spain none of these exist in the same form. A Spanish surveyor (arquitecto técnico) can inspect the building if you hire one, and the British government's own guide to buying in Spain calls that "not obligatory, but wise". The land registry extract, the nota simple, covers ownership, charges and debts. Ground movement is on neither list. The seller does not have to know it, the agent rarely does, and a viewing cannot show it. A few millimetres a year is invisible until, years later, it is a crack.
The data that measures all of Europe from orbit
Since 2022 the European Ground Motion Service (EGMS), part of the EU Copernicus programme, has published how the ground moves across almost the whole continent. It uses the radar of the Sentinel-1 satellites and a technique called InSAR. The satellite does not require any hardware on the ground. It tracks objects that already reflect its signal (roof corners, cornices, kerbs, lamp posts) pass after pass, every 6 to 12 days, and works out how far each one has moved. For every point it publishes a velocity in millimetres per year and the full time series. The product you can browse today covers 2020 to 2024. On well-measured points EGMS states a precision of the order of a millimetre per year.
It is the same source universities and geological surveys use to study subsidence, it is free, and it needs no registration to browse. Almost nobody buying a home in Spain has heard of it.
Step by step in the official viewer
The steps below were checked against the viewer on 18 September 2026. It is a 3D globe and it is heavy, so use a laptop rather than a phone and give it a few seconds after each move.
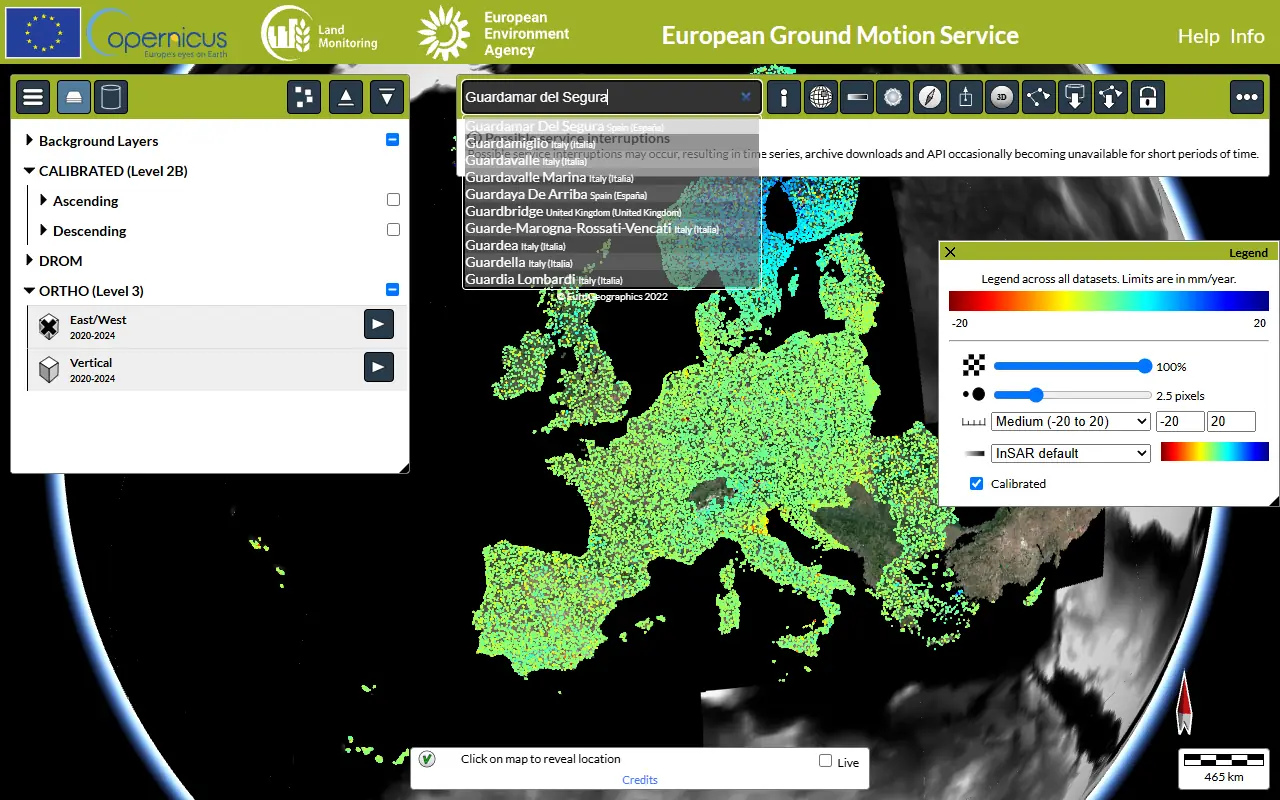
- Open egms.land.copernicus.eu. The globe loads in black first; the coloured coverage appears once a data layer is on.
- Open the layers menu (the ☰ button, top left). Under ORTHO (Level 3) make sure Vertical 2020-2024 is switched on. That is the layer to read: it expresses how much the ground goes up or down, in mm/year, on a regular 100 m grid. Leave East/West off for now.
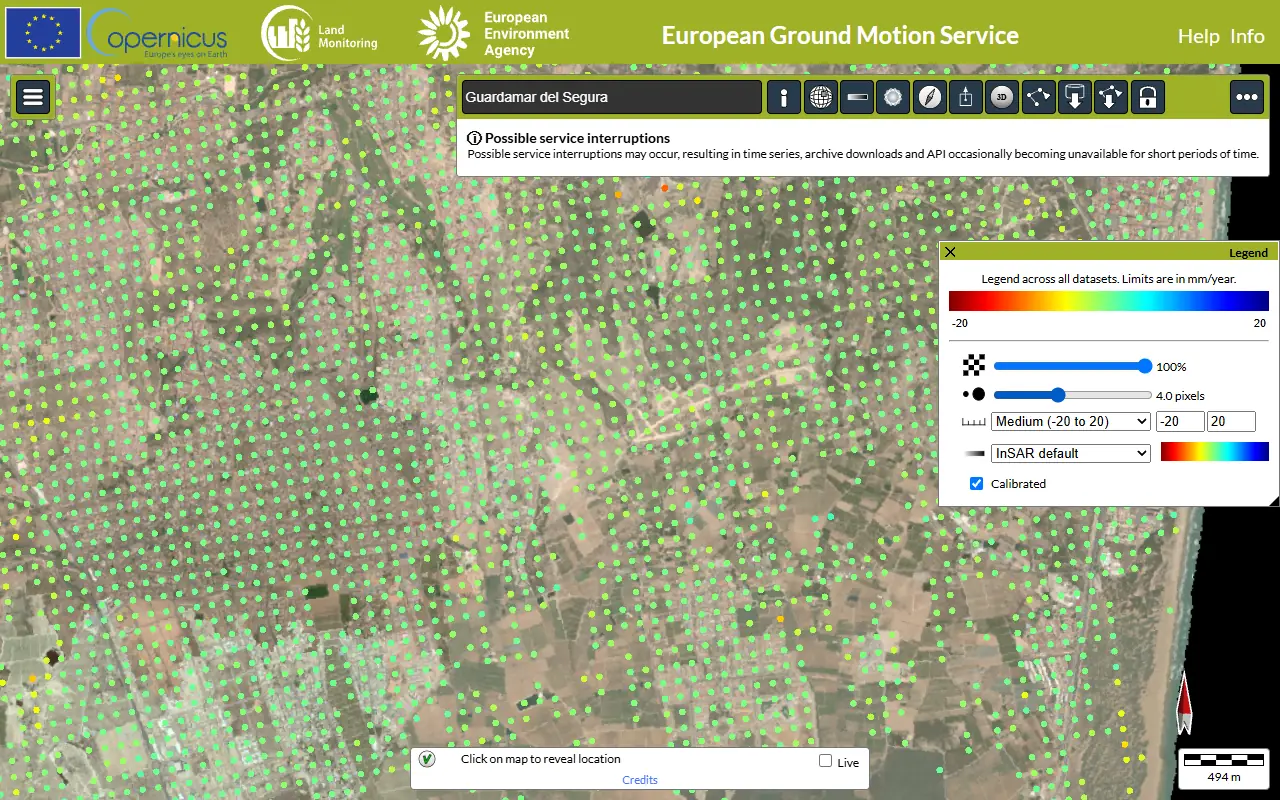
- Click the … button (top right) to reveal the toolbar and its search box, Place/coordinates. Type the town and pick it from the suggestions. A red dot marks it. Latitude and longitude also work.
- Zoom in with the mouse wheel until a grid of coloured dots covers the map. Each dot summarises a 100 m by 100 m cell, not one building. The colour encodes the speed; the legend is in the same toolbar.
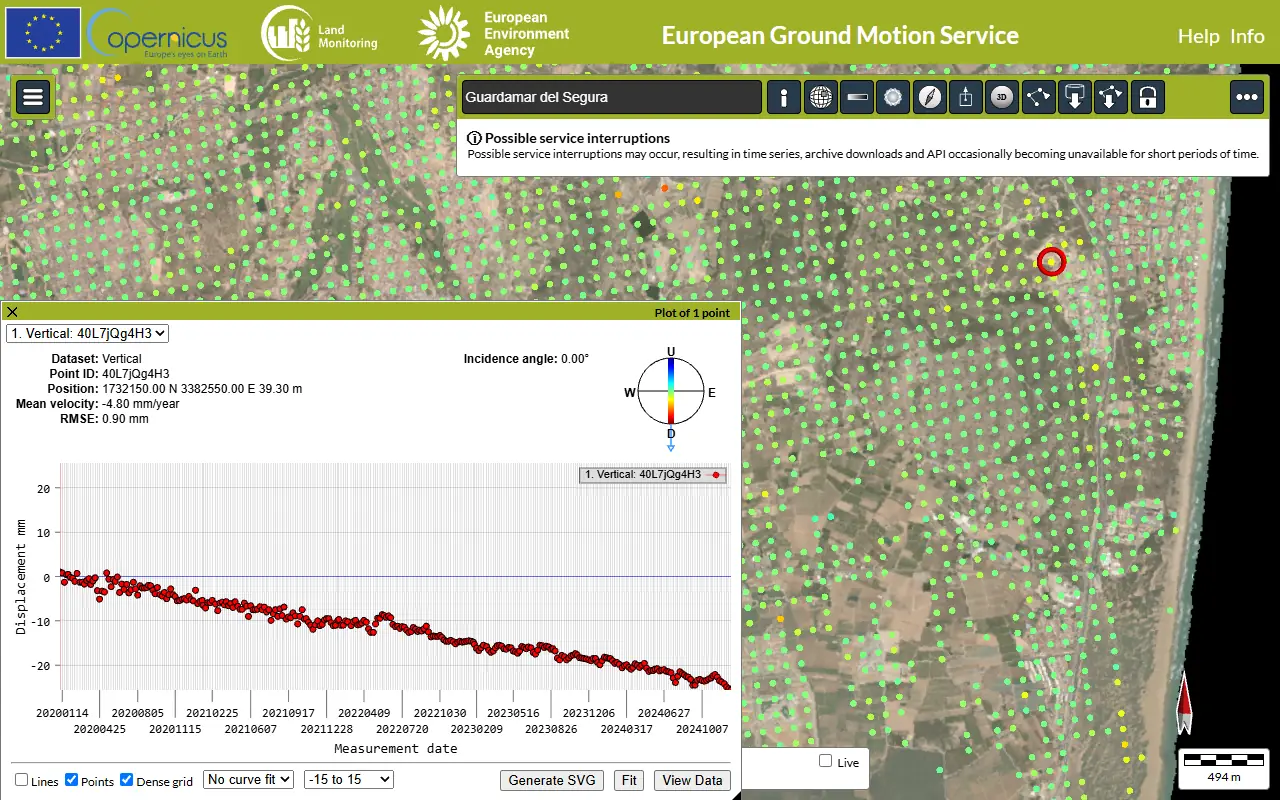
- Click a dot. A panel opens with Mean velocity in mm/year, RMSE (how noisy the fit is) and the time series: displacement in millimetres, one reading every 6 to 12 days from January 2020 to late 2024. View Data lists the numbers.
- Now click three or four neighbouring dots, not just the one on the house. The comparison is the whole point, as the next section explains.
- For the curious: the CALIBRATED (Level 2B) layers, Ascending and Descending, are the actual measurement points on the buildings. They are measured along the satellite's slanted line of sight, not vertically, and the two orbits can give different signs for the same movement. Skip them unless you know what you are doing.
How to read the number: four checks
| Check | What to look at | In short |
|---|---|---|
| Sign | Negative is down. Positive is up (it happens, for instance when an aquifer recovers). | Direction |
| Size | Around ±2 mm/year is what stable ground looks like across most of Spain. Homefax flags a building from −2 mm/year relative to its surroundings, and treats −3.5 and beyond as needing attention. | Threshold |
| Trend | Open the time series. A straight, steady slope over five years is the signature of real settlement. A zigzag that repeats every year is usually seasonal (clay swelling and shrinking with rain, thermal expansion) and much less worrying. | Pattern |
| Comparison | The number alone says little. If the whole district drifts down at the same rate, the building is in the same boat as its neighbours (regional subsidence, relevant for services and the area, not for that structure in particular). If the building moves and the neighbours do not, that is differential movement, the pattern most associated with cracks from settlement. | Context |
A worked example, from our own sample report. The flat in Guardamar del Segura (Alicante) that we use as a sample report in English sits on 203 satellite points. They move at −0.7 mm/year. Alarming? Its 300 m surroundings move at −0.8 mm/year. The difference is +0.1, well inside ±2, so the building is stable: it goes with its ground. About a kilometre south of the town centre, away from that building, one cell of the vertical grid reads −4.8 mm/year with a clean, straight slope, about 22 mm down over the five years. Same municipality, a very different story, and only the neighbours around each cell tell you which one you are looking at.
One dot is weak evidence
This is the part most people get wrong, and we measured it. The satellite does not measure "the building": it measures the reflectors that happen to bounce its signal back. With few reflectors the building's average rests on very little data and the noise explodes. Over 21,613 buildings in nine Spanish zones, buildings with only one or two measurement points came out as "moving" by chance 18.1 per cent of the time, and those with three to five points 10.2 per cent. With sixty or more points the ±2 mm/year threshold sits eight times above the noise. So a single red dot on a house is a reason to look closer, not a finding. Homefax only issues a firm verdict when the uncertainty band around the value clears the threshold; otherwise it says so.
Where Spain moves
Subsidence is not spread evenly. It concentrates where aquifers are heavily pumped and where soils are soft. Among the cases documented in the scientific literature and visible in EGMS itself: the Alto Guadalentín around Lorca (Murcia), sinking at one of the fastest rates in Europe, of the order of centimetres a year in its most intense phase, driven by groundwater extraction; stretches of the Segura river plain; former marshland and deltas along the Mediterranean and around Doñana. Much of the coastline foreign buyers favour is built on exactly that kind of ground, reclaimed lagoons and river plains, which is why the check matters more there than inland.
Even so, movement is measured point by point. Two buildings in the same street can behave differently. The useful question is never "does this area sink?" but "does this address move, and does it move differently from its neighbours?".
What the satellite cannot tell you, and what to do if the number moves
It does not assess a crack, it does not see the foundation and it does not look inside. It tells you whether there has been a sustained, measurable movement over five years, which a twenty-minute viewing cannot. If the address you are looking at comes out moving:
- Do not panic and do not walk away on the number alone. A gentle regional drift shared by the whole district is not the same as a marked differential movement.
- Cross-reference it with what you can see. Go down to the garage and the basement and look for cracks that run diagonally across walls, doors that no longer close, steps between floor tiles.
- Ask the community administrator (administrador de fincas) for technical reports, past shoring works or special levies (derramas), and for the minutes of recent meetings.
- If anything does not add up, hire a surveyor on site: a Spanish arquitecto técnico or a RICS surveyor working in Spain. They are the only ones who can judge the foundation and a specific crack. Take the satellite series with you: it saves them the guessing about "how long has this been going on".
Homefax does this for the exact building
The Homefax report takes the building's own satellite points, compares them with their 300 m surroundings, and gives you the verdict with its uncertainty, in plain English, alongside 16 other checks on the same property from official Spanish public data: official flood zones, seismic zoning, radon, what stood on the plot since 1956, noise, land classification and more. It is informative and orientative, it is not a survey and it does not replace one. €39, delivered by email within one working day.
Order a report in English See the sample reportFrequently asked questions
Can I check ground movement under a property in Spain for free?
Yes. The European Ground Motion Service, part of the EU Copernicus programme, publishes ground movement measured by the Sentinel-1 radar satellite for almost all of Europe, Spain included. The viewer at egms.land.copernicus.eu is free and needs no registration. The current product covers 2020 to 2024.
What is a normal value in mm/year?
Ground that stays within about ±2 mm/year is what stable ground looks like across most of Spain. A negative value means the ground is going down. What matters most is whether the building moves differently from its surroundings and whether the trend is steady over the years rather than a seasonal zigzag.
Does a negative number mean the house will crack?
No. A whole district drifting down a few millimetres a year, all together, is a different situation from one building sinking faster than its neighbours. And a single measurement point is weak evidence, as the section above explains. The satellite gives you a reason to ask questions, not a verdict on the structure.
Is this a substitute for a survey?
No. The satellite measures whether fixed points on a building have been moving over five years. It does not assess a crack, the foundation or anything inside. A surveyor on site is the only one who can do that. What the satellite gives them is a context that did not exist before.