PROPERTY REPORT
Guardamar del Segura
RC 3548901YH0134N · issued on 27/09/2026 · ref. HF-3548901YH0134N-20260927
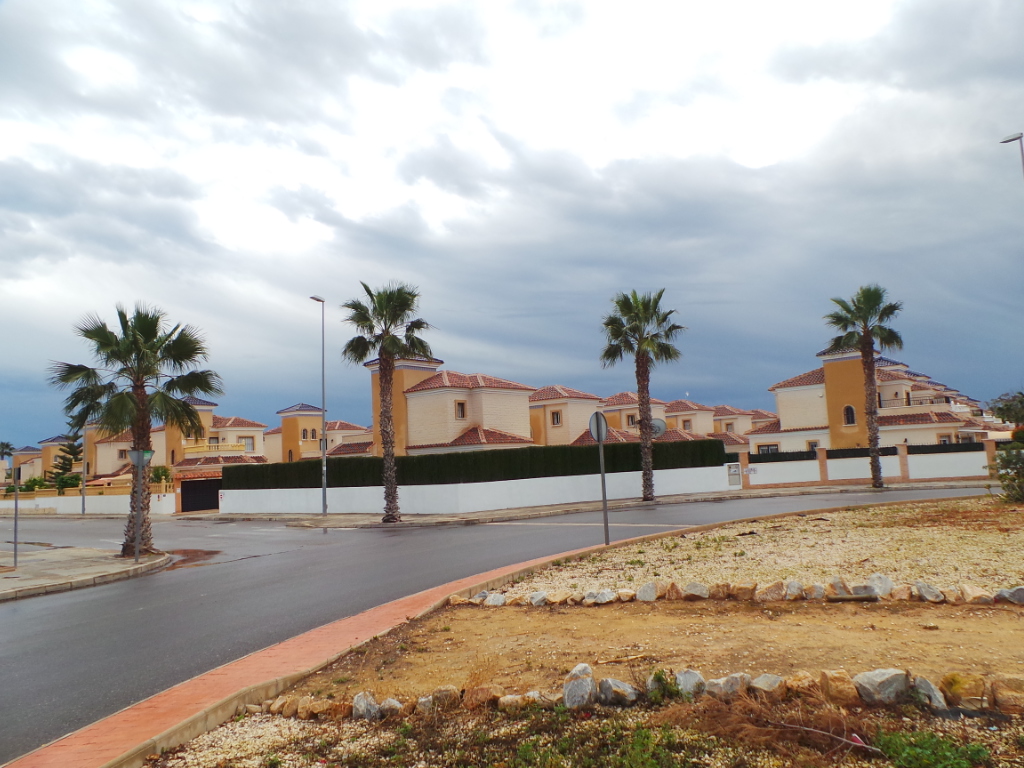
façade © D.G. del Catastro
The essentials
Overall, this property does not present notable issues in the checks carried out, but it is in an area with a building regulations aspect worth knowing about.
ATTENTION: BUILDING REGULATIONS
Only for new construction or renovation
Seismicity. Very high hazard (NCSE-02, ab 0.15 g). This mainly affects how construction or renovation work is carried out, not the day-to-day use of the property. module 09 →
The terrain around the building shows no significant movement (satellite), it is not in an official flood-prone area and the municipality is not in a radon zone.
GOOD TO KNOW
Provincial figure, not street-level
Public safety. Conventional crime in the province (45 per 1,000 inhabitants) is above the national average (11% higher). This is an average for the whole province, not for the neighbourhood or the street, and it is divided only among registered residents. It is advisable to check it by visiting the area at different times and asking neighbours. module 15 →
None of this replaces a visit or an in-person inspection. The method, source and limits of each point are set out below, and at the end you will find the points to check → with what is worth asking, requesting or reviewing.
The report at a glance
| 01 | Ground movement | ✓ STABLE | 0.0 mm/year relative to its surroundings · 203 points |
| 02 | Cadastral record | ✓ | development of 54 properties · 54 dwellings |
| 03 | History of the land | ✓ | 4 aerial survey periods · 1956 → present |
| 04 | Official flood risk | ✓ OUTSIDE | outside flood zone · nearest 500-year flood zone more than 2 km away |
| 05 | Sunlight hours by façade | ✓ | best-oriented façade west · 1.7 hours of direct sunlight in mid-winter |
| 06 | Energy efficiency | NO CERTIFICATE | no registered certificate for the property · 19 currently valid in the building |
| 07 | Price and market | ✓ | local housing market · no valuation for this specific property |
| 08 | Radon gas | ✓ OUTSIDE ACTION ZONE | P90 of 101-200 Bq/m³ at this point (CSN) |
| 09 | Seismicity | ⚠ VERY HIGH SEISMIC HAZARD | basic seismic acceleration 0.15 g (NCSE-02 standard) |
| 10 | Surroundings and proximity | ✓ | N-332 at 2.2 km · airport 27.5 km |
| 11 | Land constraints | ✓ | underground watercourse at 1.5 km · coast at 2.8 km · HV line at 407 m |
| 12 | Land classification | ✓ | Suelo urbanizable (land designated for development) · New residential development area |
| 13 | Local climate | ✓ | 17.9 °C average · 302 mm/year · 28 days ≥30 °C |
| 14 | Forest fires | WOODLAND IN THE SURROUNDINGS | 48 fires in 2006-2015 · 4.8/year · woodland at 493 m |
| 15 | Public safety | ⚠ ABOVE AVERAGE | 45/1,000 inhabitants · above the national average (provincial) |
| 16 | Industrial facilities | ✓ | none within <5 km · the nearest at 6.0 km |
| 17 | Roof solar potential | ✓ | ~4,917-8,195 kWh per year with a typical installation |
Each check is set out below with its method, its official source and its limits.
01 / 17Ground and building movement
✓ STABLESentinel-1 satellite · EGMS Copernicus · average velocity for the 2020-2024 period · 203 points in 50 m · estimated vertical velocity
Relative to its surroundings
0.0 mm/year · this is the verdict
Building movement
-0.7 mm/year (absolute)
Surrounding area (~300 m)
-0.7 mm/year
Data quality
3 m nearest point · 203 points
What exactly is measured
The plot is at the centre of the image. Each point is a stable reflector (roof, cornice, pavement) measured by the satellite every 6 to 12 days. The colour indicates its movement relative to its surroundings (the magnitude of the verdict).
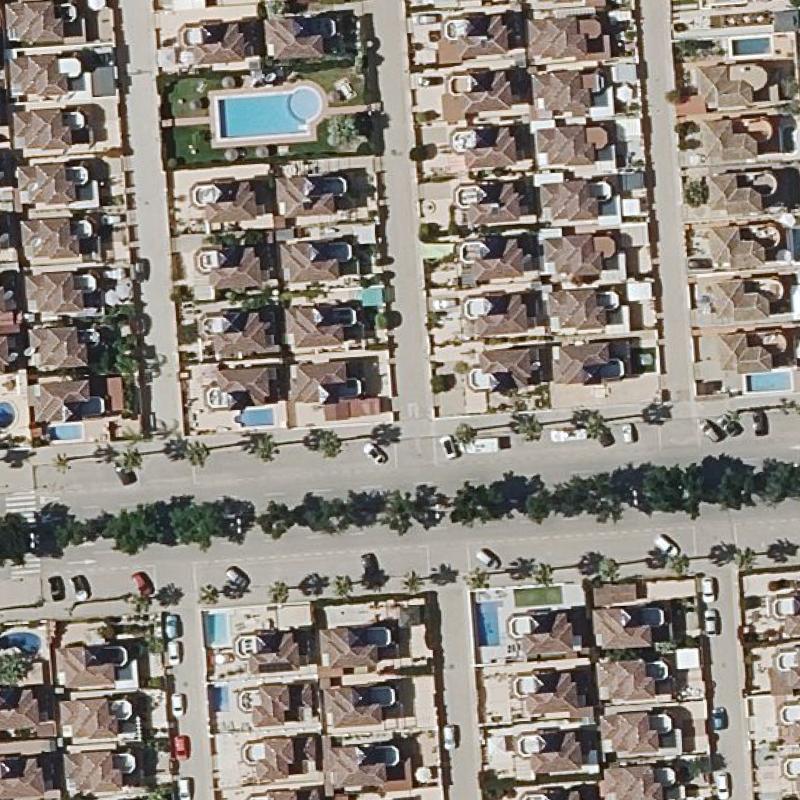
PNOA orthophoto © Instituto Geográfico Nacional (IGN)
The verdict and the speed shown are already the final ones (median of the 203 points on the property and within 50 m). The point-by-point monthly time series for this area is in the process of being incorporated. The report will include it as soon as it is available.
What it means
- The closest measurement points (within 50 m) move practically the same as their surroundings (a difference of 0.0 mm/year; we would start monitoring if it fell by more than 2 mm/year relative to its surroundings). What matters for a structure is the differential movement: a building that moves in line with the surrounding ground does not suffer the uneven settlement that cracks constructions.
- In figures: the closest points (within 50 m) move at -0.7 mm/year (absolute vertical) and their 300 m surroundings, -0.7 mm/year. The difference (what would indicate settlement specific to the building rather than the area as a whole) is 0.0 mm/year.
- The satellite measures along its line of sight (it looks diagonally). The figure shown is the estimated vertical subsidence derived from that measurement (assuming vertical movement). Typical precision: on the order of ±1 mm/year per point (Sentinel-1 interferometric radar, according to EGMS technical documentation).
In context (mm/year)
The first bars are the figures shown above. The last one is the traffic-light rating's stability threshold (−2 mm/year difference from the surroundings), which is what determines the verdict, to help gauge the magnitude.
Ground and geology
According to the IGME's Continuous Geological Map of Spain (GEODE), at a scale of 1:50,000, the ground at this point is mapped as undifferentiated colluvial and alluvial deposits (Holocene).
The IGME's expansive clay map classifies the area as non-clayey substrate (scale 1:1,000,000).
This is regional geological cartography, of an indicative nature. It does not replace a geotechnical study of the plot, which is the only thing that describes the ground beneath a specific building, with test pits and testing.
Data source: ©CN Instituto Geológico y Minero de España (IGME).
02 / 17The building according to the cadastre
Data recorded in the Sede Electrónica del Catastro (Cadastre's Electronic Office) for this reference. This is publicly accessible administrative data. It does not include ownership details.
The cadastral reference 3548901YH0134N groups together 54 properties: 54 dwellings. For the physical detail of a specific property (surface area, year, floor and door), its 20-digit reference is required. The checks in this report (ground movement, flood risk, radon, surroundings…) are for the point and apply to the whole property.
Source: Sede Electrónica del Catastro · Consulta_DNPRC (non-protected data).
03 / 17History of the land: 1956 → present
The same frame (150 m radius, the plot at the centre of each image) photographed from the air across 70 years. Source: IGN photo library.
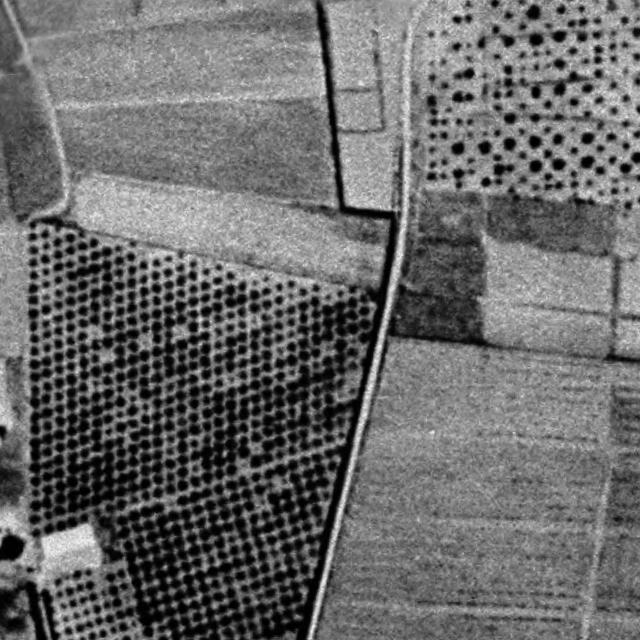
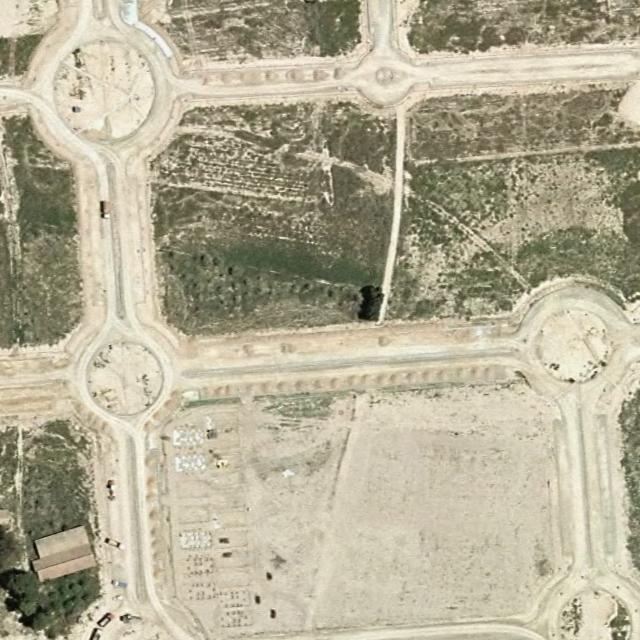
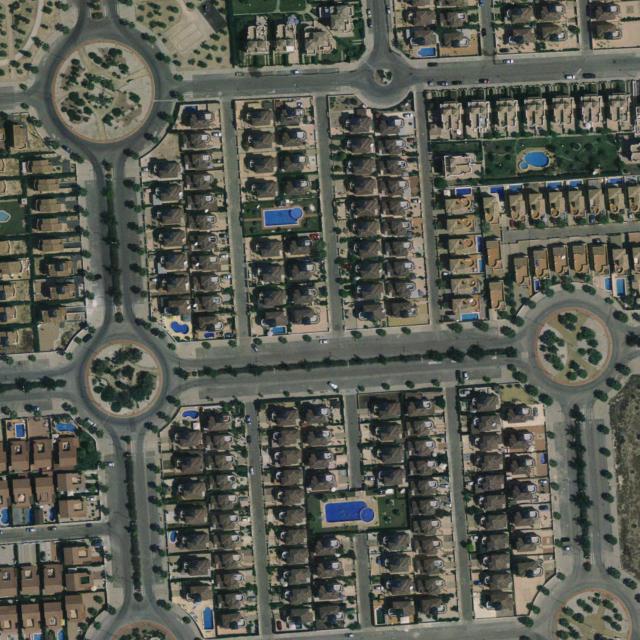
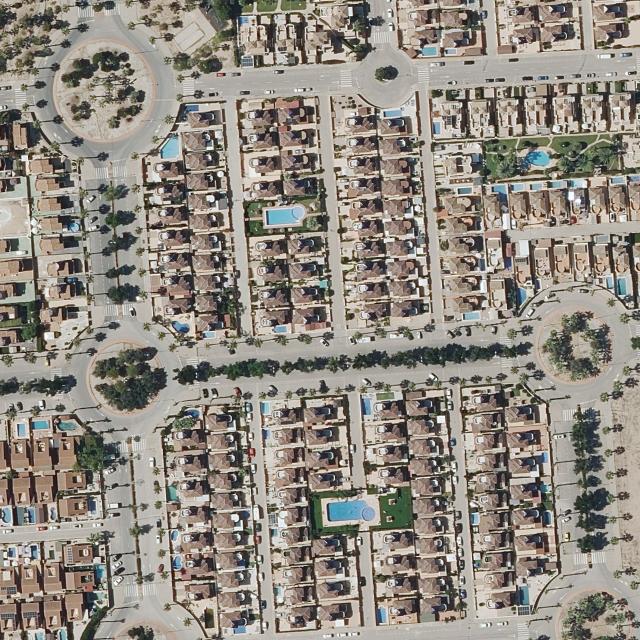
- The oldest available aerial photograph of the plot is from 1956.
- The photographs allow comparison of the plot and its surroundings in each period. Any assessment of previous land use or nearby constructions should be made based on the images themselves.
- This is a visual analysis of historical orthophotography: it shows what can be seen from the air on each date, but it does not certify the absence of soil contamination nor does it replace a geotechnical or environmental survey.
Images: Fototeca Digital © Instituto Geográfico Nacional (IGN) (American aerial survey (vuelo americano) series B, SIGPAC, PNOA).
04 / 17Official flood risk (SNCZI · MITECO)
✓ Outside flood zone According to the current official cartography, we have checked the entire geometry of the plot (72 points along the boundary and interior) and it lies outside all mapped flood zones, including the exceptional 500-year flood. The nearest T500 water extent lies more than 2 km away.
- ✓ Frequent fluvial (T=10 years): outside
- ✓ Medium fluvial (T=100 years): outside
- ✓ Exceptional fluvial (T=500 years): outside
✓ The entire plot lies outside the preferential flow zone, which is where the Public Hydraulic Domain Regulations restrict works and uses. Also checked over the full boundary of the plot, not only at the sampling points.
2 km surroundings: in blue, the low-probability flood zone (T=500 years) according to official mapping. The plot, at the centre.
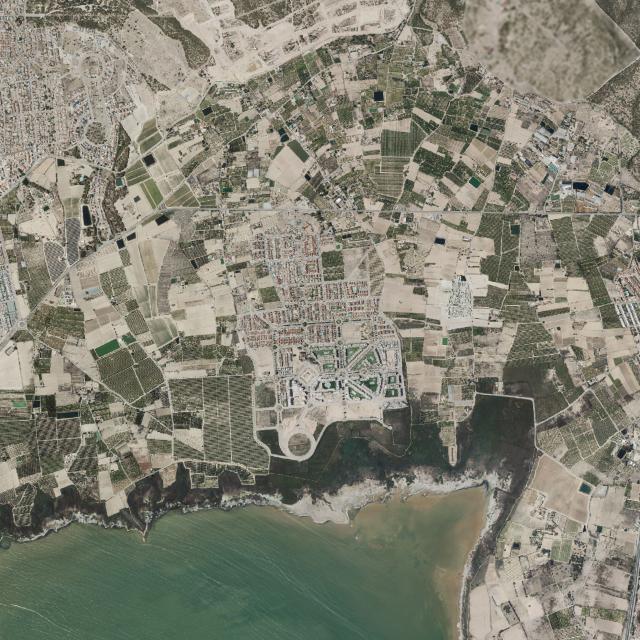

Mapping: National Flood Zone Mapping System (SNCZI) © MITECO · PNOA orthophoto © IGN
Impact assessed over 72 points along the boundary and interior of the plot (cadastre geometry), not only at its centre: the result is that of the most exposed point. The SNCZI cartography reflects official fluvial and marine flood studies as of their publication date. It does not cover all minor watercourses nor pluvial flooding (heavy rain and urban runoff). The use regime applied within the preferential flow zone also depends on the basic land status (rural or developed) and on municipal planning, which we do not assess here.
05 / 17Sunlight hours by façade
☀ Limited winter sun on the main section: the best façade (west) receives 1.7 h; on the upper floors it reaches 3.6 h and a shorter section reaches 9.2 h (south)
Potential direct sunlight on each façade, calculated over the real outline of the building (cadastral footprints and heights) and the sun's path at this latitude. Colour according to winter sun: ≥3 h · <3 h · no sun.
Building floor plan · north at top
THE FAÇADES
The building is detached and the 2,028.8 m of its perimeter are external façade, with no party walls shared with neighbours.
WHAT TIME THE SUN COMES IN · WEST FAÇADE
THE HIGHER UP, THE MORE SUN · WEST, 21 DEC
SUN THROUGHOUT THE YEAR · WEST (average hours of sunlight per day)
In total, this façade receives approximately 1,407 h of direct sunlight per year, according to the model.
- The building is not the same height along its entire perimeter. Over 1,515.3 m it rises to two storeys and over 517.7 m it has a single storey. Each section is calculated at its actual height, and the two-storey part accounts for 75% of the façade.
- The hours above are for the longest section of each orientation. When an orientation has several walls, the range between the one that receives the least and the one that receives the most is shown.
- This is a geometric calculation of the potential direct sunlight on the real outline of the building according to the cadastre, section by section, each at its corresponding height. It includes the shadow of neighbouring buildings and the terrain relief up to 15 km, but not vegetation, awnings or the recesses of individual windows, and assumes 3 m per floor. The actual hours for a given property depend on its exact position within the building.
Envelope, footprints, and building heights: Dirección General del Catastro (INSPIRE). Relief: MDT © Instituto Geográfico Nacional. Solar geometry: proprietary calculation (NOAA algorithm). Results are indicative.
06 / 17Energy efficiency (registered certificates)
No certificate registered The entire property has been checked, because without the 20-digit reference it is not possible to search for the certificate of a specific dwelling, and none is recorded under the property's name in the register consulted (certificates from the Comunitat Valenciana register). This does not indicate anything about its actual efficiency: it simply has not been certified, or it was certified before the register's coverage began.
- The property has 20 certificates on record (19 in force). Emissions ratings of the certificates in force: E ×17 F ×2, the most repeated is E. Each certificate reflects a specific property (orientation, floor, renovations), but the building's envelope is shared: it is a good indicator for the property as a whole.
- Data as recorded in the regional register as of 27/09/2026. The certificate is issued by a technician using the data available at that time and may not reflect subsequent renovations. The rating is standardised and actual consumption depends on how the property is used.
Source: Registre de Certificats d'Eficiència Energètica d'Edificis de la Comunitat Valenciana (ICV · Generalitat Valenciana).
07 / 17Reference price for the area
Average appraised value of open-market housing in the province of Alicante (Q1 2026). Guardamar del Segura does not publish municipal statistics (only municipalities with more than 25,000 inhabitants have them), so this reference is provincial: it gives the order of magnitude, but the price in your specific area may deviate considerably.
Average price
1,992 €/m²
Existing homes (>5 years)
1,974 €/m²
Year-on-year change
▲ +15.7%
5-year change
▲ +53.3%
Average price trend (Q2 2020 → Q1 2026)
- This reference covers several dwellings and the report does not detail a specific property: to compare it with a specific dwelling, provide its 20-digit reference. The area price is provided only as context.
- This is the average of the appraisals carried out in the area by appraisal companies, which value properties for financial purposes, such as a mortgage guarantee. It is not the asking price on property portals nor the closing price before a notary.
- Market: between Q2 2025 and Q1 2026, 1,421 home sales were recorded in Guardamar del Segura (this figure is municipal). The market is more active than its recent average (+20% compared with the average of the last five full years, 1,187 per year).
- Rent (SERPAVI 2024): the median in Guardamar del Segura was €6.85/m²·month for collective housing (flats) (typical range 5.33–8.37). We do not calculate gross rental yield: the rent figure is for Guardamar del Segura, but the sale price published in the statistics is provincial, and combining two different scopes would produce a percentage that does not describe either the municipality or the province.
Source: MIVAU, average assessed value of open-market housing (provincial series). Quarterly statistics; provincial series (Guardamar del Segura, having 25,000 inhabitants or fewer, does not publish a municipal figure). Sales: MIVAU, Number of residential property transactions by municipality. Rent: MIVAU, State System of Housing Rental Indices (SERPAVI, based on tax source data).
Would you like to compare it with the deed price (the actual closing price before a notary)? The Portal Estadístico del Notariado publishes the average price per m² of sales over the last 12 months. Search for Guardamar del Segura to compare it with this reference.
Purchase expenses and taxes
In the Comunitat Valenciana, the general ITP rate for a used dwelling is a tiered rate based on the total value of the property (in the Comunitat Valenciana the rate applies to the full value, so exceeding one million euros increases the tax on the ENTIRE price, not just the excess).
This report covers the entire property (54 dwellings), and the costs shown are for purchasing one of them. We do not estimate its value, so the amounts are given as price examples. Look for the row closest to the price you are quoted.
| Purchase price | ITP | Notary | Register |
|---|---|---|---|
| €150,000 | €13,500 (9%) | from €383 | from €197 |
| €300,000 | €27,000 (9%) | from €469 | from €249 |
| €600,000 | €54,000 (9%) | from €642 | from €352 |
| €1,200,000 | €132,000 (11%) | from €849 | from €490 |
The ITP is paid on the deed price or on the cadastral reference value of the property, if it is higher (if the property has no reference value, the comparison is with its market value). Notary and Land Registry fees follow their official schedule with VAT, and the invoice is usually higher because copies, pages and disbursements are added. The gestoría, if you use one, is freely priced (it has no official schedule): ask for a quote, and as a guide ours costs around €300.
General indicative rate (2026); reductions for main residence, young people, large family or VPO may lower it if their requirements are met, which in each region include value or income limits. It is advisable to confirm this with the regional tax agency.
08 / 17Radon gas
✓ Outside action zone
The municipality of Guardamar del Segura does not appear among the radon action zones of the Technical Building Code (DB-HS6). This does not guarantee total absence (radon also depends on the specific ground and construction) and the figure refers to the MUNICIPALITY under the regulation, not to this particular plot.
P90 potential at the plot's point (Bq/m³), on the five classes of the CSN map.
- Radon is a naturally occurring radioactive gas that seeps up from the subsoil (it is more common in granite terrain) and accumulates in rooms in contact with the ground, such as ground floors and basements. The WHO identifies it as the second leading cause of lung cancer after smoking.
- The CTE classification is municipal: it indicates the potential of the area, not the exact concentration at this property, which depends on the floor, ventilation and contact with the ground. The only way to know it is to measure it (long-duration domestic kits, ~€30–€50).
- At the exact point of the plot, the Radon Potential Map of Spain (CSN, 2017) estimates a P90 potential between 101 and 200 Bq/m³. The P90 is the level reached only by the most exposed building out of every ten in the area, that is, a high-end reference (one in ten exceeds it) rather than what should be expected within the property. This map is built using real measurements and the geology of the terrain, and it is more precise than the municipal classification because it looks at this specific point rather than the whole municipality.
Source: CTE DB-HS6, Appendix B, radon action zones (measurements by the Nuclear Safety Council). Point potential: Radon Potential Map of Spain, CSN, 2017.
09 / 17Seismic hazard
⚠ Very high seismic hazard
The municipality of Guardamar del Segura has a basic seismic acceleration ab = 0.15 g according to the NCSE-02: very high seismic hazard. In this area the seismic-resistant standard applies and affects the structural design of the building.
Seismic hazard of the municipality based on its basic acceleration (NCSE-02), across the four classes we use to summarise it.
- The NCSE-02 (Seismic-Resistant Construction Standard) assigns each municipality its basic seismic acceleration (ab) in its Annex, and declares it applicable from 0.04 g, although below 0.08 g it exempts constructions of normal importance with well-braced frames (art. 1.2.3). The four classes used here to summarise it (low <0.04 g, moderate 0.04–0.08, high 0.08–0.12 and very high ≥0.12) are ours, to place the figure at a glance. This is a municipal hazard figure, not a measurement of this building.
Source: NCSE-02, Norma de Construcción Sismorresistente (RD 997/2002), Annex: basic seismic acceleration by municipality.
10 / 17Surroundings: proximity and noise
SURROUNDINGS
Approximate distance and orientation to the transport infrastructure with the greatest acoustic impact (geometric proximity on the cartography, which also includes tunnelled or underground sections, which do not emit noise at surface level). Distance alone does not measure noise, so we cross it with the official strategic noise map to give the Lden level for the point where data is available.
- Nearest motorway or dual carriageway: N-332 (dual carriageway) 2.2 km to the east.
- Railway: no railway line in use within 15 km.
- Airport: Alicante-Elche Miguel Hernández Airport (ALC), its centre 27.5 km to the northeast.
We cross-checked the point with the official Strategic Noise Map (MITECO) and there is no noise contour within 800 m (the nearest one, the 55 dB(A) line, lies at around 3.3 km). This map only plots contours from 55 dB(A) upwards in this area, and only around large urban agglomerations and major road and rail routes, so the point falls below 55 dB(A) on the official map, or outside what that map covers.
Source: OpenStreetMap road and rail network (© OpenStreetMap contributors) and commercial airport network; data from 2026-07-04. Distances to roads and routes are to the nearest point of their path, with an uncertainty of a few tens of metres (the path is simplified for the calculation). The airport distance is to its centre, so its runways and boundary may be considerably closer.
11 / 17Constraints and proximity of the land
CONSTRAINTS
Proximity to features that may condition land use: watercourses, coastline, high-voltage power lines and industrial land. This is a geometric approximation, it does not delimit the legal protection zones (public hydraulic domain policing zone, coastal easement, electrical easement), which are set by the competent authority through its official mapping.
- Watercourse: Canal de los Riegos de Levante at 1.5 km to the northwest.
- Coastline: at 2.8 km to the east.
- High-voltage power line: an overhead line at 407 m to the northeast.
- Industrial land: an industrial estate at 660 m to the east.
Source: OpenStreetMap (© OpenStreetMap contributors). Approximate proximity as of the consultation date. The official boundary corresponds, for watercourses, to the Confederación Hidrográfica and, on the coast, to the Demarcación de Costas del Estado, and takes precedence over this estimate.
Services and everyday surroundings
Proximity to everyday services: public transport, education, healthcare, food shops and green spaces. This is a geometric approximation of straight-line distance (not actual walking time), intended to give an idea of how well connected and equipped the area is. It is not an assessment or a rating of the property.
- Public transport: El Campo bus stop at 694 m to the north (3 stops or stations within 1 km in a straight line).
- Education: none within 1.5 km.
- Health: Farmacia El Raso at 598 m to the north.
- Food shops: Mercadillo Campico market at 959 m to the east.
- Green areas: Plaça de l'Olivera garden at 148 m to the northwest (7 green spaces within 1 km in a straight line).
Source: OpenStreetMap (© OpenStreetMap contributors), as of the query date. Coverage depends on what the community has mapped and may be incomplete, especially in rural areas. It is advisable to verify on-site.
12 / 17Urban land classification
SUELO URBANIZABLE (LAND DESIGNATED FOR DEVELOPMENT)
Land class and planning designation (the zoning assigned by the planning authority) at the point of the plot, according to the urban planning of the Comunitat Valenciana (ICV · Generalitat Valenciana). This is informative data, taken from approved planning: the municipal plan and, where applicable, the territorial plan, which on rustic land usually sets the conditions.
- The point is classified as Suelo urbanizable (developable land) according to the urban planning of the Comunitat Valenciana (ICV · Generalitat Valenciana) (land earmarked for urban development). As the plot already has a building on it, the land is in fact developed and this label may lag behind reality; even so, it is advisable to confirm with the municipal council that the development of the sector has been formally received and has no outstanding charges.
- Urban zoning designation (planning zone): New residential development zone (code ZND-RE).
- Class and designation come from the municipal planning integrated into ICV · Generalitat Valenciana. They may lag behind the latest municipal amendment, which prevails. It is worth checking them with the town hall.
This class has been assessed at the central point of the plot, not across the whole plot, because this region is queried through its own planning scheme, which we resolve point by point here. On large or irregular plots other parts might have a different class from the centre, so it is advisable to check with the municipal council if the intended use affects a specific area.
Source: Urban planning of the Comunitat Valenciana (ICV) · Generalitat Valenciana. Data as of the consultation date. The integrated planning may not reflect the latest municipal amendment, which prevails.
Habitability and occupancy certificate
DOCUMENT TO REQUEST
In the Comunitat Valenciana, a declaración responsable de segunda ocupación (formerly the licencia de ocupación) is required to sell the property and to take out a new contract for water, electricity or gas (not when simply changing supplier) once more than 10 years have passed since the first occupancy licence was granted. This is the document certifying that the dwelling meets the legal habitability conditions, and it must be provided by the owner. The law does not state that the notary must refuse to sign the sale without it. If the dwelling never had an occupancy licence, it is always required in those two cases (Ley 3/2004 on building regulation, art. 33); each town council has its own procedure.
This report does not check whether this specific dwelling holds the valid document (it is not public data searchable by property): it is guidance on that autonomous region's regime in 2026. The regime is regional and partly municipal, and has changed in several regions: confirm it with the property's municipal council.
Building Evaluation Report (IEE)
NO IEE ON RECORD
No IEE is registered for this building.
The Building Evaluation Report (IEE/ITE) assesses the building's state of conservation, accessibility and efficiency. Which buildings it applies to, within what timeframe and under what conditions is set by each autonomous community and each city council (in the Comunitat Valenciana and the Basque Country, also single-family homes over 50 years old). The state-wide 50-year schedule that was in the land law was annulled by ruling 143/2017 of the Constitutional Court. Source: IEEV.CV register (Generalitat Valenciana), CC BY, as of the consultation date. This is the data from the regional register: it does not replace reading the full report or an on-site inspection. The Comunitat Valenciana and the Basque Country are, for now, the only regions with this register openly searchable by building.
13 / 17Local climate
Normal climate values for the period 1991-2020 from the reference AEMET station for this point, SAN JAVIER AEROPUERTO (MURCIA), at 31.6 km and 4 m altitude.
Average temperature
17.9 °C max 22.5 · min 13.3 °C
Heat (days ≥ 30 °C)
28 per year · typical annual maximum 35.8 °C
Frost (days ≤ 0 °C)
2 per year · typical annual minimum -0.5 °C
Annual precipitation
302 mm 64 days with some rainfall
Heavy rain (≥ 30 mm)
2.2 days per year · 8.2 days ≥10 mm
Humidity and wind
71 % humidity · wind 14.9 km/h
Source: AEMET, normal climatological values 1991-2020. This is the climate of the reference station, indicative of the point, not a measurement of the property. The local microclimate (altitude, orientation, proximity to the sea or a valley) may differ. The station is 31.6 km away, so it should be read as a regional reference.
Light pollution
ILLUMINATED
The satellite measured 42 nW/cm²·sr of artificial night-time light over the area of this address in 2025, that is, artificial light typical of an urban environment. This is an annual average for a cell around 464 m per side, so it describes the surroundings and not the specific window of a property, which depends on the orientation, the height and whether there is a streetlight in front.
To put it in context, measured on this same scale: a protected area with no settlements nearby (for example Roque de los Muchachos, a Starlight reserve) gives 0; a village of around a thousand inhabitants, between 0.5 and 3; a city centre, between 40 and 100; the most illuminated spots in Spain exceed 100.
- If you are sensitive to light when sleeping, it is worth checking during the viewing what each window faces, whether there is a streetlight or a sign opposite, and what kind of blind or curtain it has. It is one of the few things about the surroundings that can be fixed cheaply from the inside.
- The measurement is of light escaping upwards, which is what the satellite sees. An interior courtyard or a narrow street can be much darker than its cell, and a warehouse with floodlights, much brighter.
Source: VIIRS Nighttime Lights (VNL) v2.2, masked annual composite · Earth Observation Group, Payne Institute for Public Policy, Colorado School of Mines. 2025 annual composite, CC BY 4.0. Cropped to the Spain window and quantised to uint8 on a logarithmic scale by Homefax. Source: EOG, Colorado School of Mines.
14 / 17Forest fires
WOODLAND IN THE SURROUNDINGS
Forest fire risk of the area, combining the point's proximity to woodland (urban-forest interface), recent fires detected by satellite and the municipality's historical frequency of fires.
Proximity to forest area (wildland-urban interface)
The nearest woodland (scrubland) is 493 m to the (W). woodland in the surroundings.
Approximate distance to woodland/scrub according to OpenStreetMap (© OpenStreetMap contributors). This is not official fuel-load mapping. Proximity to woodland is one of the factors that weighs most heavily on the property's risk.
Recent fires and fire activity (satellite)
No significant fire is recorded by satellite within a radius of 10 km around the point in the last 5 years: this is a favourable sign. Within that radius and period, 15 scattered thermal hotspots are recorded, consistent with agricultural burning or isolated activity, which do not on their own constitute a fire.
Thermal hotspots from the European EFFIS system (Copernicus EMS; VIIRS/MODIS/Sentinel-3 satellites). Satellite detection, indicative of the surrounding area and period, not an assessment of the plot. Scattered hotspots consistent with agricultural burning and clusters attached to an industrial combustion facility (flares, furnaces) are discarded as fires.
Historical frequency in the municipality (Guardamar del Segura, Alicante)
Total 2006-2015
48 fires · 4.8/year
Of 1 ha or more
5 fires
Small fires (< 1 ha)
43
Source: General Statistics on Forest Fires (EGIF), IEPNB/MITECO, 2006-2015. A municipal and historical figure, indicative of the surroundings. It does not include the most recent years.
15 / 17Public safety in the surroundings (provincial data)
⚠ ABOVE AVERAGE
Conventional crime in the province of Alicante/Alacant (this municipality has fewer than 20,000 inhabitants, so the Ministry does not publish its own figure and the provincial one is used), according to the Statistical System on Crime of the Ministry of the Interior (January-December 2025), as a rate per 1,000 inhabitants (INE 2025 population register) so it can be compared with the national average.
The provincial rate is 45 conventional offences per 1,000 inhabitants per year, above the national average (40.4), that is, 11% higher. Compared to the previous year, it has risen by 5.2%.
Source: Sistema Estadístico de Criminalidad (SEC), Ministerio del Interior (January-December 2025); population: INE municipal register 2025. "Conventional crime" groups together traditional offences (robberies, thefts, injuries, etc.), excluding cybercrime. This is data for the province as a whole, not for the neighbourhood or the street: within the same province, safety varies greatly from one area to another. The rate is divided among the registered population, so in municipalities with a large seasonal population (tourism, second homes) it comes out higher than it would for the people actually living there. For guidance only. It is advisable to check it by visiting.
16 / 17Nearby industrial facilities
Industrial facilities registered in the E-PRTR (the European register of pollutant emissions and transfers, which covers large complexes: intensive farms, landfills, incinerators, cement plants, refineries, chemical plants, slaughterhouses, thermal power plants, quarries, treatment plants…) near the property. The geometric proximity to the registered location of each facility is measured.
No E-PRTR facility is registered within 5 km. The nearest one on record is Clarios Iberia Pyd, SL (metal industry), about 6.0 km away (N).
Source: E-PRTR Register · EEA / PRTR-España (MITECO). This is the registered location of the facility and its activity, not a measurement of nuisance, odour or emission at this point: the actual impact depends on wind, chimney height, corrective measures and the operation at any given time. The distance is a straight line to the point recorded in the register. Indicative data. For details of emissions from a specific facility, the PRTR-España register can be consulted, and it is advisable to check the surroundings in person.
17 / 17Roof solar potential
The roof of this building is shared by 54 dwellings: making use of it for self-consumption depends on the community of owners. The figures refer to the building's roof, not to a specific dwelling.
The building recorded at this location on the IGN cartography is for residential use: the figures refer to its roof.
According to IGN SOLAR (the Instituto Geográfico Nacional measures every rooftop in Spain using aerial laser, taking into account the building's actual shading and orientation), the building's roof at this location receives on average 1,465 kWh/m² per year (up to 2,101 in its best-oriented area). A typical self-consumption installation (3 to 5 kWp), with the panels in the best-oriented area of the roof, would produce in the order of 4,917 to 8,195 kWh per year, and would avoid in the order of 541 to 901 kg of CO₂ per year.
- The roof's radiation (kWh/m² per year) is official IGN data, calculated over the building's actual shape (PNOA LiDAR laser) and PVGIS European irradiation: it already includes the shading from what surrounds the roof and the orientation of each slope.
- The installation and production figures are an indicative estimate with standard assumptions (current panels, 22% system losses, a reference consumption of 3,500 kWh per year per household, IDAE average). An installation company would confirm these with a site visit and your actual consumption.
Source: IGN SOLAR, Solar Energy Potential of Buildings © Instituto Geográfico Nacional (Digital Surface Model from LiDAR PNOA + PVGIS irradiation © European Union + cadastre buildings), CC BY 4.0 licence. Radiation as of the query date. The avoided CO₂ is calculated using the average factor of the national electricity mix 2025 (Red Eléctrica), a conservative criterion: the actual amount avoided may be higher depending on the generation it displaces. The production, savings, and number of panels depend on the specific installation, your consumption, and the portion of roof actually available: these are indicative figures, not a commitment.
Points to check
6 points to request, ask about, or check. Each one arises from a specific finding in this report, along with the data that prompted it.
BASED ON SIGNALS FROM THIS ADDRESS (3)
Request the energy performance certificatecertificate: freely priced, in the order of €60–€150
Without the 20-digit reference, it is not possible to search for that of a specific property
As a general rule, a valid certificate is required in order to sell or let, so it is worth having one available before any transfer. If there is none, arranging it is the owner's responsibility.
Request the habitability document
Comunitat Valenciana: declaración responsable de segunda ocupación (formerly the licencia de ocupación)
In the Comunitat Valenciana, once more than 10 years have passed since the first occupancy licence, the law requires a declaración responsable de segunda ocupación (responsible declaration of second occupancy) when selling and when reconnecting utilities (Law 3/2004, art. 33). It is advisable to ask the owner for whichever one they have and check its date, to find out whether a new one will be needed. This report cannot verify whether this specific property has one, as it is not a publicly searchable piece of data by property.
See the area at different times and talk to the neighbours
Provincial figure above the national average
The conventional crime rate is above the national average, but this is an average for the whole province, not for this street: within a province, and also within the same municipality, the difference between areas can be large. It is advisable to visit the area by day and by night, on weekdays and at weekends, and to ask neighbours and, if there is one, nearby shops. In the building, it is worth checking the entrance, whether it has a doorman or cameras, and the condition of the door and the garage.
IT IS ADVISABLE TO CHECK THIS IN ANY CASE (3)
Carry out the usual in-person inspection
No significant movement in the analysed period
The satellite does not detect significant movement, and that does not replace the usual in-person inspection (dampness, installations, general condition). In the case of marked diagonal cracks above doors or windows, it is advisable to discuss it with the community of owners and, if applicable, with a technician. This report provides context, but only an in-person inspection can assess a specific crack.
Ask about heavy rain, which the mapping does not cover
Outside all mapped flood zones
The current official cartography does not place the plot within any flood zone map. Even so, it does not cover all minor watercourses or flooding from heavy rain and urban runoff, so it is advisable to ask the community, the administrator or the neighbours whether water has ever entered garages, storage rooms or basements, and to check where the water drains to.
Budget for the expenses and taxes, in addition to the price
ITP of 9% or 11% depending on the price in the Comunitat Valenciana
In addition to the price, you need to have available the ITP, the notary, the Land Registry and, if you use one, the gestoría. As a guide, on a price of €150,000 this would be around €14,080, and in the costs section you have the table with other prices. The ITP is calculated on the deed price or on the cadastral reference value, if it is higher.
How this list is structured. Each point combines, depending on the case, asking the owner, who is the source of the history and the documentation, checking with the community of owners, the managing agent or the neighbours when the matter affects the building or the surroundings, consulting the relevant authority (town council, water authority, regional register) without assuming that the answer will be quick, requesting a technical or documentary review when there is an economic or legal impact, and confirming coverage with the insurer for risks that may affect the policy. The amounts are indicative orders of magnitude for the market, not quotes.
Methodology and sources
Each check cross-references one or more public sources (mostly official, and OpenStreetMap collaborative cartography where indicated), georeferenced to the point or plot. Below, what each module looks at, where the data comes from and the date it corresponds to. "Consulted on 27/09/2026" indicates a source consulted live on the day of the report. A date or period indicates the validity of the source data itself.
| Check | Official source | Data validity |
|---|---|---|
| Ground movementVertical movement of the ground and the building (satellite radar InSAR). | European Ground Motion Service · Copernicus (EU) | Release 2020-2024 |
| Cadastral recordPhysical characteristics of the property (surface area, year, use). | Sede Electrónica del Catastro | Consulted on 27/09/2026 |
| History of the landEvolution of the plot in historical orthophotos. | Fototeca Digital · IGN (historical PNOA) | 4 aerial periods |
| Official flood riskFlood-prone areas (river and coastal) and preferential flow zone. | SNCZI · MITECO | Consulted on 27/09/2026 |
| Sunlight hours by façadeDirect sunlight on the façade, accounting for shadows from neighbouring buildings and terrain relief. | MDT · IGN + cadastre footprints | Consulted on 27/09/2026 |
| Energy efficiencyRegistered energy performance certificate (CEE) of the property or the building. | Regional certificate register (Comunitat Valenciana) | Register as of 27/09/2026 |
| Area priceReference price and liquidity of the local market. | MIVAU · Ministerio de Vivienda | Period Q1 2026 |
| Radon gasRadon zone of the municipality and potential of the point. | CTE DB-HS6 · Nuclear Safety Council | CTE DB-HS6, Appendix B |
| Seismic hazardBasic seismic acceleration of the municipality. | NCSE-02 Standard (RD 997/2002) · Ministry of Transport | NCSE-02 (RD 997/2002) |
| Surroundings and noiseProximity to roads, railway and airport, and official noise. | OpenStreetMap + Strategic Noise Map · MITECO | Road network as of 04/07/2026, noise, official cartography from 31/12/2021, live service consulted on 27/09/2026 |
| Land constraintsIndicative proximity to watercourses, coast, power lines and industrial land. | OpenStreetMap | Consulted on 27/09/2026 |
| Land classificationUrban planning classification of the land (urban, developable or rural). | ICV · Generalitat Valenciana | Consulted on 27/09/2026 |
| Local climateClimate profile of the reference station (the nearest one, adjusting for elevation difference). | AEMET · normal climatological values | 1991-2020 normals |
| Forest firesHistorical frequency in the municipality, proximity to woodland and recent fires detected by satellite. | EGIF · IEPNB/MITECO + OpenStreetMap + EFFIS · Copernicus | EGIF period 2006-2015; satellite on 27/09/2026 |
| Public safetyConventional crime rate for the province (/1,000 inhabitants) vs national average. | Statistical System on Crime · Ministry of the Interior + INE municipal register | Year 2025 |
| Industrial facilitiesIndicative proximity to registered industrial facilities (mega-farms, landfills, cement plants, chemical plants…). | E-PRTR Register · EEA (IED/E-PRTR database) + PRTR-España (MITECO) | Register as of 26/09/2026 |
| Roof solar potentialRoof solar radiation and indicative self-consumption estimate (energy and CO₂). | IGN SOLAR · Instituto Geográfico Nacional (LiDAR PNOA + PVGIS irradiation) | Consulted on 27/09/2026 |
| Ground and geologyLithology of the point (1:50,000) and, when the mapping publishes them, expansive clays and karst (1:1,000,000). | IGME · Geological and Mining Institute of Spain (CSIC) | Consulted on 27/09/2026 |
| Light pollutionArtificial night light over the area, measured by satellite. | VIIRS VNL · Earth Observation Group, Colorado School of Mines (CC BY 4.0) | Annual composite 2025 |
REPORT ISSUANCE
Report prepared by Homefax (homefax.es) on 27/09/2026, based on public sources (mostly official, and OpenStreetMap where indicated) consulted on that date.
Report reference: HF-3548901YH0134N-20260927
Any questions about the report, or does the address not match the property you requested? Write to us at info@homefax.es, quoting the reference above. If the location was wrong due to an error on our part, we will correct it at no cost. If you believe any data is incorrect, we will review it against its official source (service guarantee).
Another property?
Check the ground movement of any address in Spain for free (our Spanish site), or order the full 17-check report in English.
Free check (in Spanish) Order a report · €39Sources: European Ground Motion Service (EGMS), Copernicus, European Union (release 2020-2024, line-of-sight satellite measurement projected to vertical assuming vertical movement); Sede Electrónica del Catastro (property coordinates); IGN Digital Photo Library (orthophotography); Sistema Nacional de Cartografía de Zonas Inundables, MITECO; Registre de Certificats d'Eficiència Energètica d'Edificis de la Comunitat Valenciana (ICV · Generalitat Valenciana); OpenStreetMap, © OpenStreetMap contributors (surroundings and constraints); Urban Planning of the Comunitat Valenciana (ICV) · Generalitat Valenciana (land classification); AEMET (standard climatological values 1991-2020); IGME, Instituto Geológico y Minero de España (CSIC) (terrain and geology); EGIF, Estadística General de Incendios Forestales (IEPNB/MITECO) 2006-2015; EFFIS, European Forest Fire Information System, © European Union, Copernicus Emergency Management Service (satellite hotspots); IEEV.CV, Informe de Evaluación del Edificio de Viviendas de la Comunitat Valenciana (Generalitat Valenciana · Institut Cartogràfic Valencià), CC BY (technical building inspection); Sistema Estadístico de Criminalidad, Ministerio del Interior (January-December 2025) and INE population register 2025; E-PRTR Register (European Environment Agency and PRTR-Spain, MITECO); IGN SOLAR, Building Solar Energy Potential (Instituto Geográfico Nacional, with PVGIS irradiation © European Union); VIIRS Nighttime Lights (VNL) v2.2, Earth Observation Group · Payne Institute for Public Policy, Colorado School of Mines, CC BY 4.0 (2025 annual composite, cropped and quantised by Homefax; product citation: C. D. Elvidge, M. Zhizhin, T. Ghosh, F-C. Hsu, "Annual time series of global VIIRS nighttime lights derived from monthly averages: 2012 to 2019", Remote Sensing 2021).
Legal notice. This report is an informative and indicative document, prepared automatically from public sources, mostly official and collaborative where indicated (OpenStreetMap), which may contain errors, omissions or update delays not attributable to us. The data reflects exclusively the period and scope indicated in each section. This report does not constitute an expert opinion, technical certificate, technical, legal, planning, environmental or financial advice, nor does it replace an on-site inspection by a qualified professional, the nota simple (a summary registry extract), or the corresponding administrative checks. The recommendations included are general guidance that do not take into account particular circumstances of the property or the buyer. The purchasing decision and prior checks are the sole responsibility of the interested party, and this document should not be the only element on which that decision is based. © Demonstration report.